

Frequency Analysis Explained is not just an academic label — it’s the practical backbone of how high-hazard industries quantify how often unwanted events are likely to happen, and how confidently those estimates can be used to guide engineering and operational decisions. In oil and gas processing, petrochemicals, construction, power generation, logistics, and heavy manufacturing across the UAE, every major risk study — from HAZID and HAZOP through LOPA, Bowtie, and full site-wide QRA — stands on the strength of the frequency inputs that feed it. When those inputs are clear, justified, and traceable, organizations can demonstrate compliance to regulators, set risk tolerability targets aligned with IEC 61511, API Recommended Practices, and ADNOC HSE requirements, and make better choices about safeguards, maintenance, and emergency preparedness.
This article unpacks the core building blocks of frequency estimation in a process safety context. It explores how initiating event rates are derived and adjusted by protection layers, how uncertainty is communicated, and how real-world operating conditions in the Gulf — from ambient temperatures and dust exposure to contractor interfaces and logistics corridors — shape the realism of your numbers. Whether you manage risk at a refinery, run shutdowns on an offshore platform, supervise piling works on a high-rise build, or assure storage terminal integrity, a solid grasp of frequency analysis turns abstract hazards into measurable, actionable priorities.
Who Does This Affect?

Frequency modeling touches many roles and teams, because the inputs and implications span engineering, operations, and governance. If your decisions rely on risk numbers — even indirectly — frequency estimation is part of your world.
- HSE managers and compliance officers seeking alignment with OSHAD SF requirements, Dubai Municipality expectations, and UAE Civil Defence approvals for major hazard installations and building systems.
- Process safety engineers responsible for hazard studies (HAZID/HAZOP), LOPA worksheets, SIL verifications per IEC 61511, and the event frequencies in QRA consequence modeling.
- Maintenance and reliability leads who set proof test intervals and maintenance strategies that directly change protection layer performance — and therefore event frequencies and PFDavg.
- Project and design engineers in FEED and detailed design phases selecting layouts, segregation, emergency shutdown philosophy, and passive fire protection assumptions that influence ignition, escalation, and event trees.
- Construction managers and EPC contractors planning lifting operations, deep excavations, confined space activities, and temporary works where frequency estimates help screen activities for controls.
- Terminal operators, pipeline managers, trucking coordinators, and logistics supervisors who must quantify incident rates per vehicle-km, km-year of pipeline, or transfer operation to support land use planning and route risk management.
- Executives and board-level risk committees who need coherent, defensible metrics to track risk exposure and ALARP demonstrations over time.
Because each of these stakeholders relies on the same underlying numbers viewed from different angles, the way you frame, source, and update frequency estimates becomes a shared language inside the organization. That shared understanding is where robust, auditable decision-making starts.
Why This Matters in High-Hazard Operations
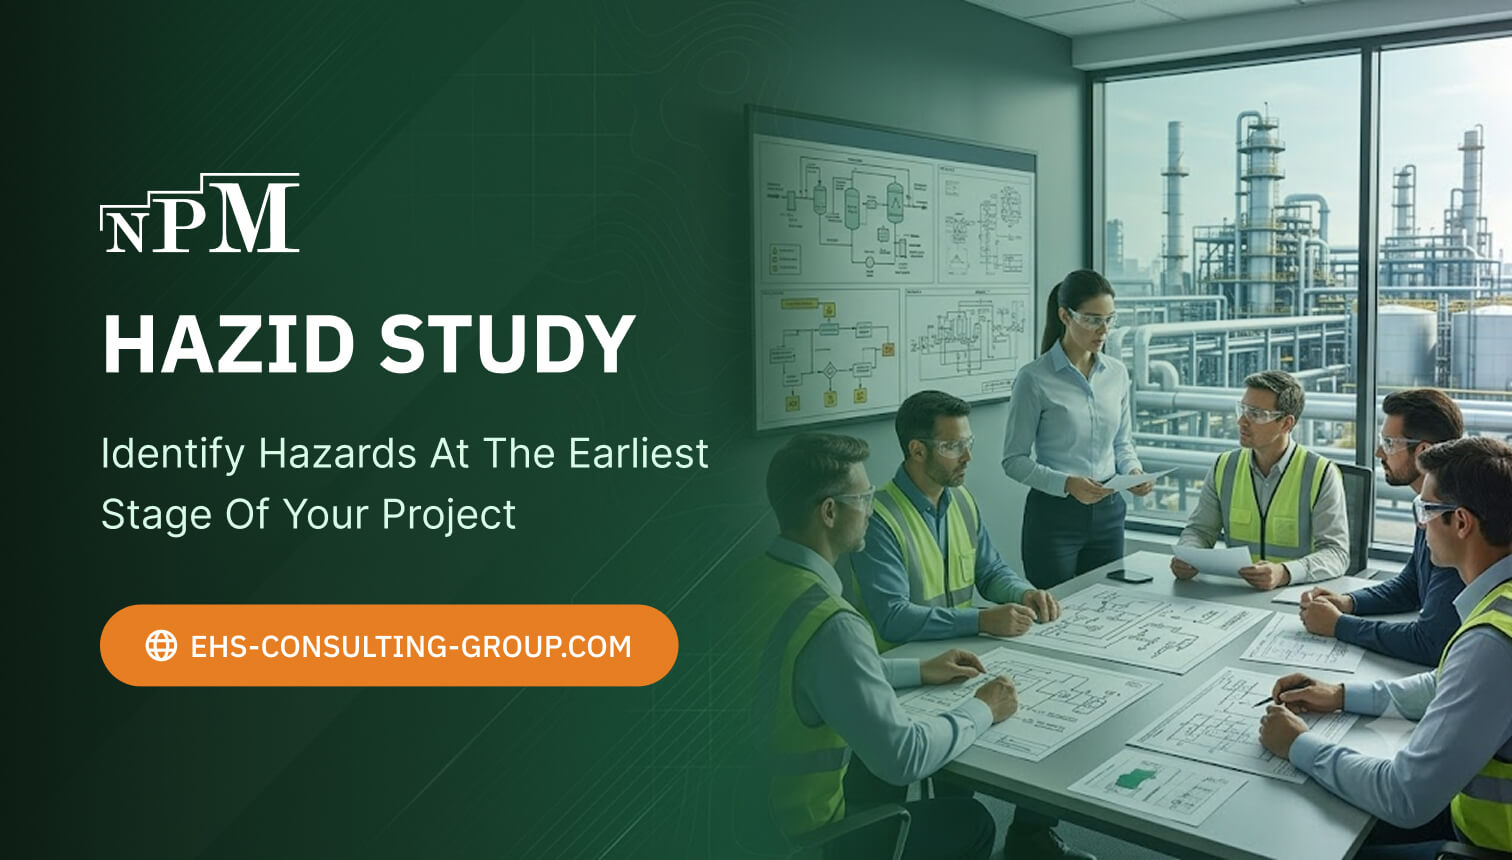
Once a hazard is identified, two dimensions define risk: how bad it could be (consequence) and how often it could occur (frequency). Consequence modeling gets much of the attention — vapor cloud explosion overpressures, flash fire contours, pool fire radiation, toxic dispersion plumes — but it is frequency that answers the question: how much of our attention, money, and management focus should this scenario receive relative to everything else we do?
Risk tolerability criteria across major-hazard sectors use frequency explicitly. Individual and societal risk contours, FN-curves, and ALARP tests are driven by the initiating event rates and conditional progressions through event trees. Under ADNOC guidelines, and consistent with CCPS and API frameworks, regulators and internal assurance teams want to see how numbers are derived, which assumptions matter most, and how uncertainty is handled. Wrong or weak frequency assumptions can mis-prioritize projects, mis-size protection systems, and undercut the credibility of a safety case or permit-to-operate submission. Conversely, realistic, transparent frequency modeling supports stronger barrier management, more focused maintenance, and clearer communication with both authorities and workforce representatives.
There is also a practical cost-of-control dimension. Frequency analysis informs where to invest: an extra instrumented safety function, better leak detection, a shorter proof test interval, or a procedural barrier with training. Making these choices without a sound frequency basis can lead to over-engineering low-return measures while leaving higher-return improvements underfunded.
Key Points to Understand

Having underlined why frequency matters, we can break the topic into foundational elements. This section offers a structured walk-through of definitions, data, adjustments, and uncertainty so that teams can anchor their models in consistent, justifiable logic.
Frequency vs. Probability vs. Likelihood

In process safety, frequency typically means events per unit time (per year) or per demand (for on-demand systems). Probability is a dimensionless measure between 0 and 1 that can describe the chance an event occurs over a defined interval or per demand. Likelihood is a qualitative descriptor often used in risk matrices. Confusion arises when these are mixed: an initiating event frequency might be 1.0E-03 per year, while the probability of ignition given a hydrocarbon release could be 0.3, which together contribute to the branch frequency of a fire scenario in an event tree. Being explicit about units and bases (per year, per demand, per km-year, per transfer) removes ambiguity.
Initiating Events and Protection Layers
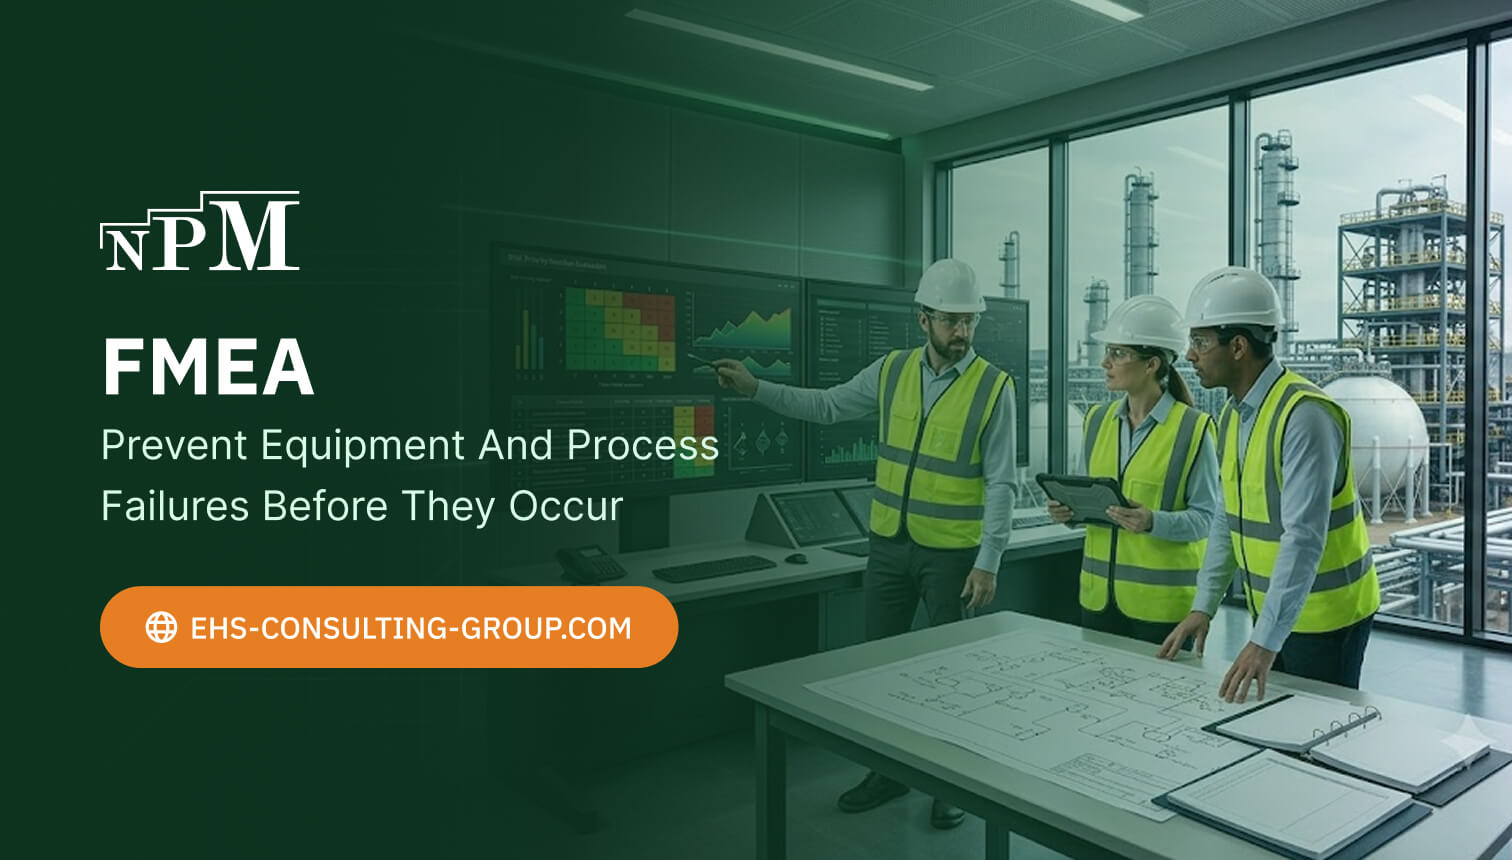
Most quantitative approaches start with an initiating event — for example, a small bore piping leak, overfill of a tank, or failure of a crane lifting point. That initiating rate is then modified by independent protection layers (IPLs) such as a high-high level trip, a relief valve, a dike, or an operator intervention step. In LOPA, each IPL is assigned a probability of failure on demand (PFD). To align with IEC 61511, the PFDavg for safety instrumented functions depends on design and proof test intervals. The branch frequency of the hazardous outcome is the initiating frequency multiplied by the residual probability that all IPLs fail to prevent progression. Clear independence assumptions matter — common-cause failures can erode apparent risk reduction if not modeled with beta factors or equivalent approaches.
Conditional Modifiers and Event Trees

Event trees structure how scenarios unfold: release size classes, immediate ignition, delayed ignition, detection success, isolation, blowdown, and escalation controls each have conditional probabilities. For pipelines and terminals, hole size distributions and detection coverage are critical; for offshore platforms, gas detection voting logic and blowdown timing are pivotal. Establishing a logical path through such trees converts a single initiating rate into a set of outcome frequencies suitable for consequence modeling in tools used for QRA.
Data Sources and Normalization

Use multiple sources to triangulate initiating frequencies: corporate incident databases (with near-misses), industry consortia publications, public study reports, and equipment reliability handbooks. Normalize to the right exposure measure: per equipment item-year for valves, per km-year for pipelines, per transfer for loading arms, per crane lift, per excavation-days on a construction site. Where data are scarce, structured expert judgment can be used — with documented rationale and calibration where possible. To keep teams aligned on regulatory context and technical publications, many organizations maintain curated repositories; resources like CABINET NPM help teams organize and retrieve standards, guidance, and reference notes efficiently across global operations, so that modeling assumptions reflect current best practice rather than outdated habits.
Uncertainty and Confidence

No frequency estimate is exact. Sparse data, changing operating contexts, and evolving designs mean uncertainty must be explicit. Confidence intervals, Bayesian updating with new observations, and sensitivity studies on top contributors (e.g., ignition probability, detection coverage, proof test intervals) all help quantify how robust conclusions are. In many QRAs, a mean (or median) frequency is presented with uncertainty bands, and ALARP decisions consider both central estimates and plausible high/low bounds.
Alignment with Standards and UAE Regulatory Expectations
Frequency models should align with recognized frameworks: IEC 61511 for safety instrumented systems (definitions, SIL targets, proof testing), API RP 581 for RBI where equipment failure likelihoods feed inspection priorities, API 14C and 14J offshore safeguarding guidance, API 750/CCPS principles for process safety management, and ISO 45001/ISO 14001 for integrated risk contexts. Authorities and entities in the UAE — from ADNOC Group HSE requirements to OSHAD and Dubai Municipality — expect transparent methods, data provenance, and coherence with accepted practice. Civil Defence reviews for fire and life safety also benefit from clear ignition and escalation assumptions in QRA and safety case submissions.
| Data Source Type | Strengths | Common Pitfalls | Notes for UAE Context |
|---|---|---|---|
| Internal incident and near-miss records | Site-specific, reflects current equipment and practices | Under-reporting bias; short time windows; non-standard taxonomy | Ensure consistent classification across JV partners and contractors; reconcile multi-lingual reporting |
| Industry datasets (sector consortia, CCPS/IOGP-type compilations) | Broader sample size; benchmarks against peers | Different operating contexts; may mix old/new technologies | Adjust for ambient temperature, sand/dust ingress, and local maintenance regimes |
| Reliability handbooks and component databases | Granular equipment rates; supports LOPA/SIS design | Generic conditions; may not reflect proof test realities | Validate against vendor data and proof test results for IEC 61511 PFDavg calculations |
| Expert judgment (structured workshops, elicitation) | Fills data gaps; encodes tacit operational knowledge | Anchoring bias; optimism; lack of calibration | Document assumptions; consider Bayesian priors updated with actual observations |
| Public study reports (QRAs, safety cases) | Transparent methods; scenario comparability | Context-specific; dated assumptions | Map to current ADNOC/OSHAD guidance; review for local process and layout differences |
How This Works in Practice
Translating principles into day-to-day practice starts with scoping what needs to be quantified. In a refinery expansion, that might be the release frequencies for new unit operations (e.g., hydrocracker high-pressure loops) and connecting pipework; in a construction megaproject, the focus could be the frequency of trench collapses, crane incidents, or hot work–related fires during peak manpower periods.
Teams typically build a scenario register from HAZID and HAZOP outputs. Each credible scenario is paired with an initiating rate, adjusted for safeguards, and branched through an event tree to produce outcome frequencies. For instance:
- A pump seal failure (initiating rate per pump-year) is modified by seal system design, detection, and isolation success to give leak scenarios by size class, with ignition probabilities shaping fire frequencies.
- An overfill scenario (initiating rate per transfer) is modified by independent high-high level trips and operator surveillance; the remaining overflow rate drives bund overtopping and environmental risk outcomes.
- For pipelines, third-party interference initiating rates (per km-year) split into hole sizes, detection/isolation times, and product types to model dispersion or explosion outcomes along the route.
Many organizations then calculate aggregate risk by overlaying consequence footprints (overpressure, radiation, toxicity) and population exposure to derive individual and societal risk contours. Frequency-driven screening also helps prioritize detailed modeling: if a scenario’s estimated branch frequency is below threshold and heavily conservative, it may be deprioritized to keep analysis focused.
Maintenance decisions tie directly into frequencies. Proof test intervals feed PFDavg for SIFs; bad actor analysis for valves and relief devices updates component failure likelihoods; and management of change (MOC) captures how design tweaks — like moving a detector or changing PSV discharge — shift frequencies in subtle but meaningful ways. It is here that a living frequency dataset starts returning daily value, not just an annual compliance output.
Benefits and Practical Use Cases
Once embedded, frequency analysis becomes a versatile decision engine. Beyond its obvious role in QRA, it supports routine trade-offs, documented ALARP arguments, and communications with both authorities and internal leadership.
- Design clarity: Early-stage frequency screening informs layout choices (e.g., separation distances), detector placement, and demand rates on ESD and blowdown systems.
- Barrier management: By quantifying the contribution of each IPL to event frequency, teams can prioritize testing, spares, and upgrades to the barriers that matter most.
- Regulatory defensibility: Clear data lineage and justifications increase confidence with OSHAD, Dubai Municipality, and Civil Defence reviewers and align with ADNOC frameworks for major projects.
- Operational focusing: Frequency-ranked scenarios drive toolbox talks, permit controls, and field audits toward activities with the highest exposure (e.g., loading arm transfers, confined space entries, heavy lifts).
- Portfolio decisions: Corporate leaders compare like-for-like risk across sites using normalized frequencies (per unit throughput, per km-year), enabling smarter capital allocation.
- Emergency planning: Scenario frequencies link to credible worst cases and most-likely events, aligning drills and resource placement (e.g., foam stocks, dry chemical units, gas monitors) with quantified need.
These benefits compound when the same logic is applied consistently in projects, operations, and turnarounds. A repository of scenario frequencies that evolves with plant changes is an asset in itself, reinforcing knowledge retention across personnel turnover and contractor rotations.
Best Practices and Points of Caution
Frequency estimation is deceptively simple to start and surprisingly nuanced to sustain. The following practices help maintain rigor without paralysis.
- Be explicit about bases: Always state “per year,” “per demand,” or “per km-year,” and include population-at-risk assumptions when deriving individual/societal risk.
- Triangulate data: Use internal history, industry benchmarks, and reliability data; document why you weight one source more heavily than another.
- Model independence honestly: Where IPLs share components, environments, or maintenance teams, apply common-cause factors rather than assuming perfect independence.
- Update with purpose: Use Bayesian methods or rolling averages to incorporate new data; avoid resetting models with every single incident.
- Calibrate ignition and escalation: Ground ignition probabilities in fuel types, ventilation, congestion, and detection times relevant to your facility design.
- Capture uncertainty: Provide plausible ranges and explore sensitivity; avoid false precision with four significant figures if your data barely justify one.
- Reflect local realities: High ambient temperatures, dust ingress, and contractor skill mixes can change failure modes and detection effectiveness; account for them.
- Integrate with SIS lifecycle: Align proof test intervals, failure mode distributions, and repair times with IEC 61511-compliant calculations for PFDavg and PFH where appropriate.
Common pitfalls persist. Over-reliance on a single dataset (often generic and dated), ignoring near-miss data that are actually gold for frequency estimation, and failing to refresh assumptions after significant process or layout changes will slowly erode credibility. Also, applying probabilities copied from offshore guidance to onshore, congested facilities without adjustment can lead to poor predictions of ignition and escalation.
Frequently Asked Questions About Frequency Analysis
What is the difference between frequency and probability in risk studies?
Frequency is typically expressed as events per unit time (e.g., per year) or per demand (e.g., per actuation), while probability is a dimensionless value between 0 and 1 that represents the chance of occurrence over a defined interval or per demand. In QRAs and LOPAs, initiating event frequency is often multiplied by conditional probabilities (like ignition or barrier failure) to compute branch frequencies of hazardous outcomes.
How do we estimate initiating event frequencies when our internal data are limited?
Triangulate multiple sources: internal incidents and near-misses, industry compilations, equipment reliability databases, and structured expert judgment. Normalize to the relevant exposure measure (per km-year, per transfer, per item-year). Document the rationale for chosen values and, where possible, apply Bayesian updating as new data arrive to move from generic priors to plant-specific posteriors.
What role do protection layers play in frequency analysis?
Independent Protection Layers (IPLs) reduce the likelihood that an initiating event progresses to a hazardous outcome. In LOPA, each IPL has a probability of failure on demand (PFD). The branch frequency of the outcome equals the initiating event frequency times the product of the PFDs for all IPLs on that scenario path, adjusting for common-cause failures to avoid over-crediting independence.
How are ignition probabilities determined for hydrocarbon release scenarios?
Ignition probabilities depend on release size, fuel type, ventilation, congestion, presence of ignition sources, and detection/isolation times. Many studies use empirical relationships or categorized values (immediate/delayed ignition) calibrated against historical data and validated against facility-specific factors such as detector layout and shutdown philosophy.
Are generic frequency datasets acceptable to UAE regulators?
Yes, when used transparently and with appropriate adjustment to local context. Authorities and entities such as ADNOC HSE, OSHAD, and Dubai Municipality expect clear data lineage, reasonable localization (e.g., ambient conditions, maintenance regimes), and consistency with recognized standards like IEC 61511, API RPs, and CCPS guidance. Plant-specific experience should progressively replace generic values as observations accumulate.
How often should we update our frequency estimates?
Update when material changes occur (process modifications, layout, operating envelope) and on a set review cycle aligned with your risk management framework (e.g., annually or after major turnarounds). For SIS-related inputs, re-evaluate after proof test interval changes. Consider Bayesian updating or rolling windows to incorporate fresh data without overreacting to single events.
What is the best way to communicate frequency uncertainty to leadership?
Present central estimates with clear ranges and sensitivity highlights. Show which assumptions drive results (e.g., ignition probability or a specific IPL’s PFDavg) and how decisions would change under plausible upper and lower bounds. Avoid excessive decimal precision; emphasize decision-relevant differences rather than numerical detail for its own sake.
How does frequency analysis link to SIL verification under IEC 61511?
SIL targets arise from required risk reduction. Frequency analysis quantifies how much reduction is needed from safety instrumented functions and other IPLs. PFDavg and PFH calculations for SIS (considering failure modes, proof test intervals, common cause, and repair times) feed back into scenario branch frequencies used in LOPA and QRA, ensuring consistent, lifecycle-aligned decisions.
Conclusion: Turning Numbers into Safer, Smarter Operations
Across the sections above, we established how frequency models convert the narrative of hazards into measurable, defensible risk signals. We separated frequency from probability, showed how initiating rates are adjusted by IPLs and conditional event tree logic, and underscored the role of uncertainty and localization to UAE operating realities. We also connected the dots to standards like IEC 61511 and regulatory expectations from ADNOC, OSHAD, Dubai Municipality, and Civil Defence, and demonstrated how frequency-driven insights guide design, maintenance, emergency planning, and ALARP demonstrations. In other words, Frequency Analysis Explained is the difference between generic statements about danger and precise, auditable decisions about how to manage it.
For leaders and engineers charged with protecting people, assets, and the environment, the next step is consistency: use coherent data bases, refresh them as plants evolve, and keep the modeling logic transparent so that new team members and authorities can follow the thread. Small improvements in how you structure frequencies — from better normalization and proof test alignment to more realistic ignition assumptions — often deliver the biggest returns on risk reduction per dirham spent.
To go further on this topic, NPM’s broader Quantitative Risk Assessment Services UAE page covers this in more depth.
Our References
NPM’s references illustrate how rigorous frequency modeling translates into trusted, practical outcomes across complex projects and operating sites worldwide. In upstream and downstream oil and gas, our teams have helped embed initiating event frequency logic into hazard registers for offshore platforms, gas plants, refineries, and export terminals — with explicit normalization (e.g., per equipment item-year, per km-year) and event trees that capture detection, isolation, ignition, and escalation behavior in realistic ways. In petrochemicals and specialty chemicals, we have supported clients in aligning SIL targets to required risk reductions derived from LOPA and QRA, using component reliability, proof test evidence, and beta factor approaches to account for common cause in redundant architectures. Construction and infrastructure projects have used our frequency-based screening to prioritize controls during critical phases like deep excavations, heavy lifts, and confined space works, driving better toolbox talks and permit-to-work focus where exposure actually sits. Power generation clients have applied frequency insights to turbine enclosures, fuel gas systems, and balance-of-plant interfaces, improving barrier effectiveness and inspection prioritization in line with RBI thinking.
Beyond the models, NPM’s references show the advantage of transparent data lineage and uncertainty communication. Our work has routinely aligned with IEC 61511, API RP series, and CCPS guidance while satisfying authority expectations, from ADNOC Group HSE requirements to OSHAD and municipal approvals. This track record reflects a simple principle: when frequency inputs are credible, the entire safety argument becomes clearer, more defendable, and easier to sustain through change. If you are exploring how to improve the quality and consistency of the frequency assumptions that underpin your risk decisions, our portfolio demonstrates the methods and outcomes that organizations have found most valuable.
For more information about our references, visit Our References.
Speak With NPM
If you would like a second opinion on how your current studies handle initiating rates, IPL performance, and uncertainty — or simply want to clarify points from this article — we are happy to exchange views. A brief conversation can help determine how these concepts apply to your facility and where small changes might yield meaningful improvements. For any further questions or to speak with our team, Contact Us.