

Emergency Response KPIs are the backbone of how industrial operators in the UAE and across the region evaluate the readiness, capability, and real-world performance of their emergency preparedness and response programs. In facilities where process safety and business continuity are inseparable from daily operations—refineries, gas processing plants, offshore platforms, petrochemical terminals, power stations, large logistics hubs, and high-rise construction projects—well-designed indicators turn complex incident response systems into measurable, improvable practice. This article explores how to conceptualize, design, and use metrics that actually move the needle on readiness and outcomes, aligning with recognized frameworks such as ISO 45001, ISO 22301, NFPA 1600, and local regulatory expectations from OSHAD, Dubai Municipality, Civil Defence, MOHRE, and industry-specific bodies including ADNOC HSE Requirements.
Metrics for emergency management often suffer from two extremes: they are either too activity-focused (counting drills without asking if they build capability) or too lagging (only tracking after-action injury or asset loss). A practical dashboard balances both, connecting barrier health from Bowtie analysis, critical device readiness (e.g., PAGA systems, gas detection, firewater pumps), organizational competence (Incident Command System roles, on-scene leadership), and time-dependent performance (from alarm to muster, first-aid initiation, or isolation of energy sources). Getting this balance right has real consequences: it influences permit renewals, regulator confidence, insurance terms, and—most importantly—the ability to protect people, assets, and the environment when something goes wrong.
Who Does This Affect?
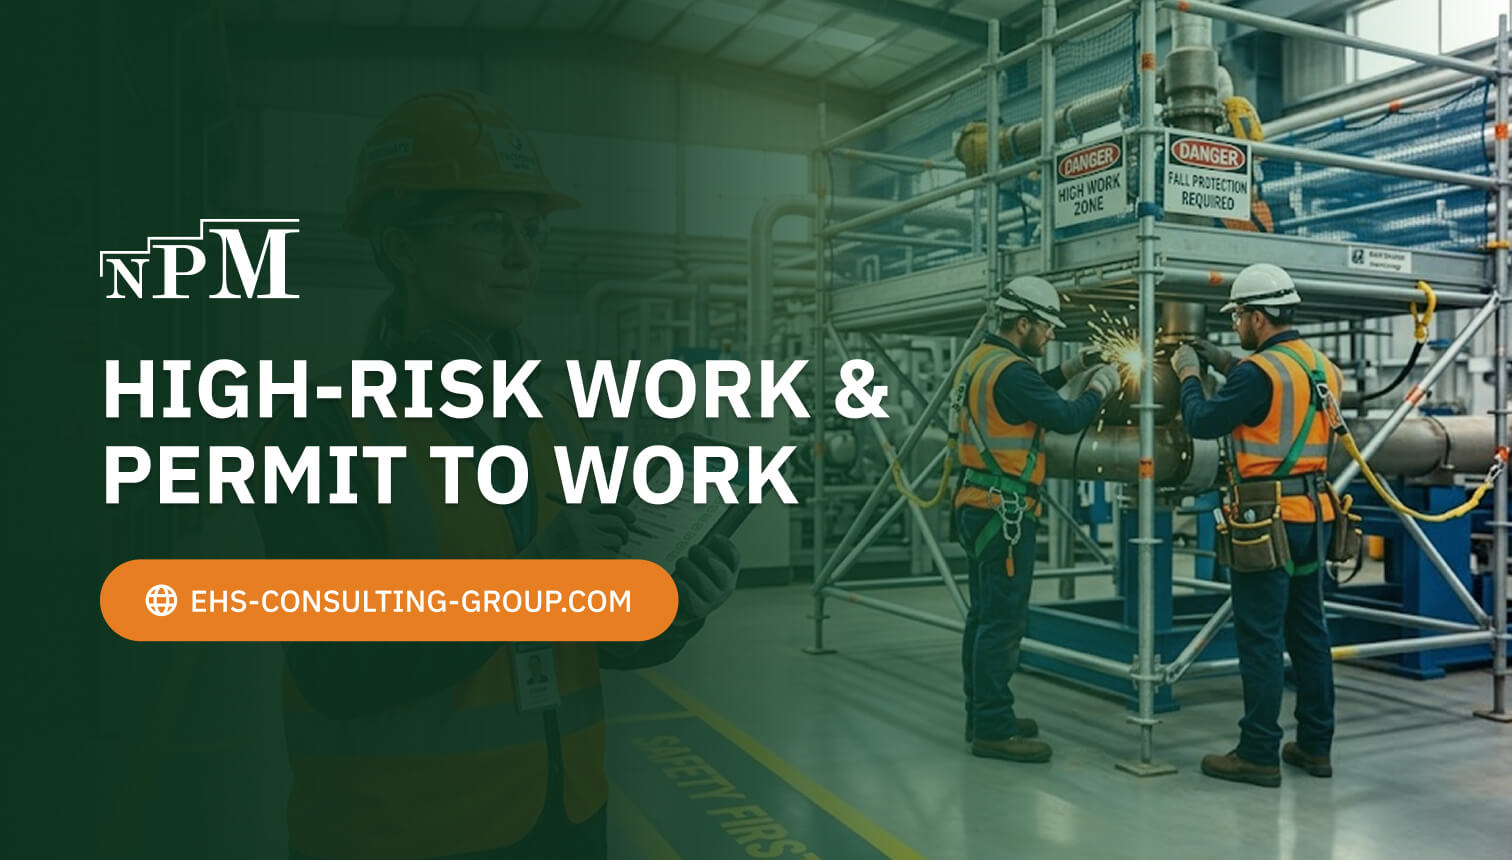
While virtually everyone on site depends on timely and effective emergency response, responsibility for selecting, tracking, and acting on indicators typically spans several roles and functions. Clarity on who uses which KPI—and why—is a prerequisite for any successful dashboard.
- Corporate and site HSE leadership: HSE Directors, HSE Managers, OSHAD Practitioners, and Process Safety Managers who align indicators with ISO 45001 and process safety frameworks (HAZOP, LOPA, Bowtie).
- Operations leadership: Plant Managers, Operations Superintendents, Offshore Installation Managers (OIMs), Control Room Supervisors who need operationally meaningful indicators tied to permits-to-work, equipment status, and shift readiness.
- Emergency, security, and business continuity teams: Emergency Response Team (ERT) Leaders, Security Managers, and BCM Coordinators who manage drills, mutual aid, evacuation, shelter-in-place, and continuity of critical services under ISO 22301.
- Maintenance and engineering: Reliability Engineers, CMMS Planners, Fire & Gas and PAGA Technicians who own the availability of safety critical elements (SCEs) tied to response (firewater pumps, hydrants, foam systems, SCBA, stretchers, spill kits, radios).
- Project and construction teams (EPC/PMC): Construction Managers, HSE Officers, and Site Engineers who manage crane operations, hot works, and dynamic site layouts where evacuation routes and assembly points change frequently.
- Logistics and warehousing: Distribution Center Managers and Dangerous Goods Officers responsible for large-footprint facilities with complex traffic flows and varying fire load profiles.
- Regulatory and external stakeholders: Corporate compliance teams coordinating with Civil Defence approvals, ADNOC group standards, Dubai Municipality permits, free zone health and safety authorities, and local port authorities.
Each of these stakeholders uses metrics differently: some to manage daily readiness, others to justify budgets, satisfy audits, or focus training. But all benefit when indicators are designed from the same risk picture and calculated the same way across sites.
Why This Topic Matters

Emergency situations are, by definition, rare and varied—and that makes them hard to manage by intuition alone. Without disciplined indicators, organizations tend to overestimate capability after long quiet periods or misprioritize improvements after headline incidents. Well-constructed measures anchor performance to risk, not to anecdotes.
Several drivers make this especially critical for high-risk operations:
- Regulatory assurance: Demonstrable compliance with OSHAD, Civil Defence, and sector requirements (e.g., ADNOC Codes of Practice) depends on documented readiness and performance evidence.
- Barrier-based risk management: Bowtie analysis and LOPA identify preventive and mitigative barriers; KPIs prove those barriers work in time-critical scenarios such as fire, loss of containment, or dropped objects.
- Incident learning: When a real event occurs, objective measures of response time, communication integrity, and command effectiveness turn investigations into targeted improvements.
- Resource allocation: Budgets for fire protection upgrades, mass notification, muster technology, or training are easier to defend when linked to KPI trends and risk reduction.
- Third-party assurance: Contractors, mutual aid partners, and tenants in shared facilities expect leading organizations to track capability, not just activity.
Put simply, you cannot manage what you do not measure—but in emergencies, you also cannot afford to measure the wrong things. The aim is to measure the few things that most influence outcomes within the time available.
Designing Emergency Response KPIs: Key Points to Understand

Translating strategy and risk into practical indicators requires a structured approach. Think in layers: inputs that create capability, processes that sustain readiness, outputs that prove execution, and outcomes that quantify consequences avoided or minimized.
| Tier | Purpose | Example Indicators | Typical Data Sources | Review Frequency |
|---|---|---|---|---|
| Input (Capability) | Ensure people and equipment exist and are fit-for-purpose | % ERT positions filled; SCBA pass rate; Fire pump availability; Radio coverage test pass rate | HR rosters, competency records, CMMS, radio test logs | Weekly–Monthly |
| Process (Readiness) | Maintain capability through routines and checks | Inspection completion on time; Drill completion vs. plan; Evacuation route audits completed | Inspection apps, training records, audit schedules | Monthly |
| Output (Performance) | Prove the response can execute as required | Time from alarm to muster; First-aid initiation time; Fire team turnout time; Isolation time for energy sources | Control room logs, stopwatch timing, CCTV timestamps | Per drill/event; Monthly roll-up |
| Outcome (Effectiveness) | Quantify impact on safety and continuity | Extent of damage contained; Time to safe state; Production downtime avoided; Environmental release volume | Incident reports, production data, environmental monitoring | Per event |
To align these layers with real risk, derive indicators from your barrier model. If Bowtie analysis shows that early detection and rapid evacuation are your most critical mitigations, prioritize measures like gas detector mean time to alarm acknowledgement, PAGA audibility coverage, and percentage of personnel accounted for within target times. If LOPA indicates high dependency on fixed suppression, track foam proportioner performance and hydrant flow assurance—then test them under realistic conditions, not only visual checks.
Some further design essentials:
- Define leading and lagging clearly. Leading measures (e.g., training currency, inspection completion, SCE availability) predict performance; lagging measures (e.g., injuries during evacuation, time to isolate) describe what happened. You need both, but bias toward leading to improve before the event.
- Normalize across sites and shifts. Use denominators (per 100 staff, per 1,000 hours worked, per square meter of protected area) so comparisons drive learning, not finger-pointing.
- Set targets from risk and legal requirements. Where standards prescribe times (e.g., mustering within 8–10 minutes depending on footprint), adopt those; where they do not, set stretch targets informed by drills and credible worst-case scenarios.
- Capture uncertainty. Confidence bands (e.g., based on sample size or drill realism) prevent false precision, especially when events are rare.
- Design for investigation. Collect enough context to learn: who was incident commander, radio channel used, wind direction, access constraints, or simultaneous operations affecting egress.
Indicator governance also matters—how data is approved, trended, and turned into decisions. For teams seeking broader guidance on decision support and organizational performance practices, see CABINET NPM for resources on structured management approaches and portfolio-level visibility.
Above all, avoid counting easy things rather than important things. A high percentage of completed drills is meaningless if evacuation times keep overrunning or the firewater jockey pump fails on demand. Likewise, a low “number of incidents” tells you little about resilience if it hides near misses and unreliable communications.
How This Works in Practice

Once metrics are defined, they must live in the rhythms of operations, not in a standalone dashboard. The most effective programs connect indicators to shift handovers, weekly toolbox talks, monthly management meetings, and annual reviews with regulators or insurers.
Consider how this plays out across different sectors:
In a refinery, a flammable gas leak triggers alarms in the control room. Relevant performance measures include time to acknowledge alarm, time to initiate plant-wide notification, ERT turnout time, isolation valve closure time, and muster completion for process areas downwind. Data can be captured from distributed control system (DCS) timestamps, radio logs, and access control headcounts. When the facility later reviews the event, the same KPIs—compared against targets—guide whether to prioritize gas detector placement, control room staffing, or evacuation route redesign.
On an offshore platform, personnel-on-board (POB) accuracy and mustering reliability dominate. Indicators track PAGA audibility, lifeboat readiness, drill turnout quality (correct donning of immersion suits, correct lifeboat loading patterns), and time to establish command posts under medevac scenarios. Where ADNOC or corporate standards specify particular turnaround times, these targets anchor the drill design and trend analysis.
In a large logistics warehouse, fire load and travel distance complicate evacuation. KPIs might include zone-based egress time, forklift shutdown compliance, sprinkler impairments per month, and thermal imaging camera readiness for search-and-rescue. Evacuation timing benefits from CCTV-assisted time stamping and anonymized heat maps of egress flow to relieve choke points.
Construction sites add a dynamic twist: ever-changing routes and crane lifts. Daily checks of assembly point suitability, crane exclusion zones, and clear signage become leading indicators, while actual response metrics include time to cordon off a dropped-object scene and time to coordinate with Civil Defence. Weekly KPI reviews inform where to move signage and how to brief subcontractors.
In a combined-cycle power plant, black start procedures and control room redundancies enter the picture. Emergency communications redundancy rate, UPS autonomy for critical alarms, and time to achieve a safe shutdown all become essential, with fire team drills simulating cable tray fires or turbine lube oil leaks.
To make this repeatable, tie measurement to systems you already use:
- Control room and DCS logs (for response times and acknowledgements)
- Access control or muster systems (badge counts, handheld reader confirmations)
- CMMS (firewater pumps, hydrants, extinguishers, SCBA inspections and repairs)
- Training systems (competency matrices, role-based refresher status)
- Incident management and investigation tools (root cause, Bowtie barrier health)
- Video analytics (for drill timing and egress bottlenecks)
- Radio systems logs (channel use, call setup time)
Finally, express KPIs visually in a way that operations leaders find intuitive. Red/amber/green thresholds with arrows for trend direction keep attention where it matters. When a threshold is missed, leaders should know exactly which corrective action exists—update a muster plan, schedule an additional drill emphasizing radio discipline, or service the foam proportioner.
Benefits and Practical Use Cases

When indicators are built from real risk, organizations see tangible benefits—not just prettier dashboards. Here are several concrete outcomes and scenarios where robust measurement improves emergency readiness and results:
- Faster, safer evacuations: By trending time-to-muster by zone and shift, a petrochemical plant identified consistent overruns on night shift linked to locked crossovers; fixing those routes cut average muster time by three minutes.
- Higher SCE reliability: Tracking fire pump test outcomes and corrective maintenance closure times helped a terminal improve on-demand performance from 92% to 99.5%, confirmed during a real dockside incident.
- Better training allocation: An offshore asset moved from generic drills to scenario-based exercises after KPIs showed strong turnout times but weak command handovers; targeted coaching cut handover confusion to near zero.
- Regulator and insurer confidence: Demonstrating stable performance against ISO 45001-aligned measures and Civil Defence requirements supported streamlined renewals and favorable insurance terms.
- Contractor integration: On a multi-contractor construction site, common indicators (e.g., radio check pass rate, assembly headcount reconciliation time) aligned expectations and improved subcontractor compliance.
- Capital justification: Comparing PAGA audibility gaps with evacuation timing data created a compelling case for speaker upgrades where it mattered most, avoiding a site-wide replacement.
These use cases show how measurement clarifies priorities and substantiates decisions. Rather than debating perceived weak points, teams act on credible evidence tied to risk and performance.
Best Practices and Points of Caution

Good indicators are deceptively hard to craft. A few disciplined practices and guardrails help:
- Start from risk, not convenience. Use Bowtie barriers, HAZOP deviations, and LOPA outcomes to anchor what must be measured. If mitigations depend on early detection and evacuation in 10 minutes, build indicators around those times and enabling systems.
- Keep the list short and decisive. A dozen meaningful measures beat 50 that no one can remember or influence. Prioritize those with clear, rapid corrective actions.
- Define formulas unambiguously. State numerators/denominators, inclusion/exclusion rules (e.g., drill realism criteria), and data sources. Publish them with version control.
- Normalize for fairness. Different footprint sizes, headcounts, and hazard profiles demand adjusted indicators for cross-site comparisons.
- Triangulate evidence. Pair timing data with qualitative observations (command clarity, radio discipline). Numbers rarely tell the full story alone.
- Avoid perverse incentives. Goodhart’s Law applies: if “zero missed drills” becomes the goal, people will run token drills. Use balanced measures that value quality and outcomes, not just counts.
- Protect reporting culture. Do not punish near-miss reporting; reward accuracy and candor in debriefs. Otherwise, lagging metrics will look artificially positive until a real surprise occurs.
- Integrate with management systems. Embed indicators in ISO 45001 OHSMS and ISO 22301 BCM cycles. Link corrective and preventive actions to management review and MOC processes.
- Audit data quality. Periodically verify timings and device availability against independent evidence (CCTV, handheld timekeepers, maintenance logs).
- Review annually—or after major changes. When a plant expands, shifts strategy, or updates emergency schemes in consultation with Civil Defence, refresh targets and methods.
Organizations that apply these practices turn indicators into a learning engine, not just a scorecard. The line between compliance and performance narrows as teams iterate on what truly matters.
Frequently Asked Questions About Emergency Response KPIs
How many indicators should a site track for emergency response?
Enough to reveal risk and drive action, but not so many that attention diffuses. Many high-risk sites operate effectively with 10–20 core measures across capability, readiness, performance, and outcomes, plus a handful of asset-specific metrics (e.g., foam system reliability) where risk justifies detail.
What is the right mix of leading and lagging measures?
Bias toward leading indicators (competency, SCE availability, inspection completion) to prevent failure, while retaining a concise set of lagging indicators (evacuation times, injuries during drills/events, containment outcomes) to confirm real-world performance. A 70/30 split is common, but the right ratio depends on risk and learning needs.
How do we benchmark targets across different facilities?
Normalize by risk drivers and scale. Use per-100 staff or per-1,000 hours worked for people-based metrics; for performance times, adjust targets based on footprint, elevation changes, and egress complexity. Combine internal trend benchmarking with external guidance from standards (e.g., NFPA 1600, ISO 22301) and regulator expectations.
Do drill metrics translate to real incidents?
They can—if drills are realistic and measured well. Include injected uncertainties (blocked routes, communications challenges), use independent timing, and score qualitative elements such as command clarity. Track confidence intervals to reflect that drills are proxies, not perfect simulations.
What data systems best support KPI collection?
Leverage what you already have: DCS/control room logs for alarms, access control for headcounts, CMMS for SCE status, training systems for competency, and incident management tools for root cause and barrier health. Where feasible, augment with video analytics to time evacuations and identify bottlenecks.
How often should we review and update targets?
Formally at least annually, and after any major change: site expansion, process modification, workforce shift patterns, or significant incidents. Major regulator interactions (e.g., Civil Defence re-approvals) are also good moments to realign targets and measurement methods.
How do Emergency Response KPIs relate to process safety metrics?
They complement each other. Process safety indicators track barrier integrity and loss of containment risk; emergency response measures focus on mitigating the consequences when barriers fail. Use Bowtie models to ensure coherent coverage from prevention through mitigation.
How can we prevent KPIs from encouraging the wrong behavior?
Balance activity counts with quality and outcome measures, publish definitions, and review unintended effects during management reviews. If a metric is driving gaming or tokenism, redesign it—prioritize those that reveal risk exposure and prompt meaningful corrective actions.
Bringing the threads together, the most successful programs use indicators that mirror their unique risk profile, are practical to collect, and are integrated into decision-making at every level—from control room supervisors to corporate HSE committees.
A well-crafted indicator set begins with a clear understanding of hazard scenarios, barrier performance requirements, and the human and technical factors that determine response. Designing from that foundation, and validating through drills and post-incident learning, turns numbers into safer, more resilient operations.
To go further on this topic, NPM’s broader Emergency Response Training UAE page covers this in more depth.
Our References
NPM maintains a worldwide track record helping industrial organizations transform emergency preparedness into measurable, reliable performance. Our references span upstream and downstream oil and gas, petrochemicals, power generation, large construction programs, and complex logistics networks—environments where the speed and quality of response define outcomes. Across these projects, a common thread is rigor: aligning indicators to barrier-based risk models, specifying unambiguous formulas and data sources, and embedding reviews into management routines. Whether supporting an offshore asset to refine mustering and medevac timings, assisting a refinery with firewater and PAGA reliability metrics, or guiding a multi-tenant industrial park to harmonize evacuation KPIs across contractors and tenants, the emphasis stays on evidence, practicality, and sustained improvement. These case histories show how organizations have used measurement to justify targeted upgrades, refine training priorities, and demonstrate assurance to regulators and insurers. They also illustrate the value of cross-sector learning—translating insights from one facility type to another while respecting each site’s unique hazards and constraints. For readers interested in how KPI design, data flow, and governance come together in real settings, NPM’s portfolio offers concrete examples and outcomes, from early design-phase advice through operational roll-out and review cycles. Each reference underscores a simple principle: indicators are only as good as the decisions they enable and the risks they reduce.
For more information about our references, visit Our References.
Get in Touch
If you would like to discuss how to tailor emergency performance indicators to your facility’s hazards, workforce, and regulatory environment, NPM is available to share perspectives and practical considerations. We welcome questions from HSE leaders, plant management, and operations teams seeking to strengthen readiness and decision-making.
For any further questions or to speak with our team, Contact Us.